ENGINEER
SYSTEM
RELIABILITY
Build Reliability Block Diagrams, configure real component failure and repair data, then solve them two ways — Monte Carlo simulation or an exact analytical (Markov) solver — to predict availability and reliability over time, all in one integrated platform.
See Ramly in motion
From a single point of failure to a redundant system proven across 10,000 simulated failures — the core idea behind Ramly in half a minute.
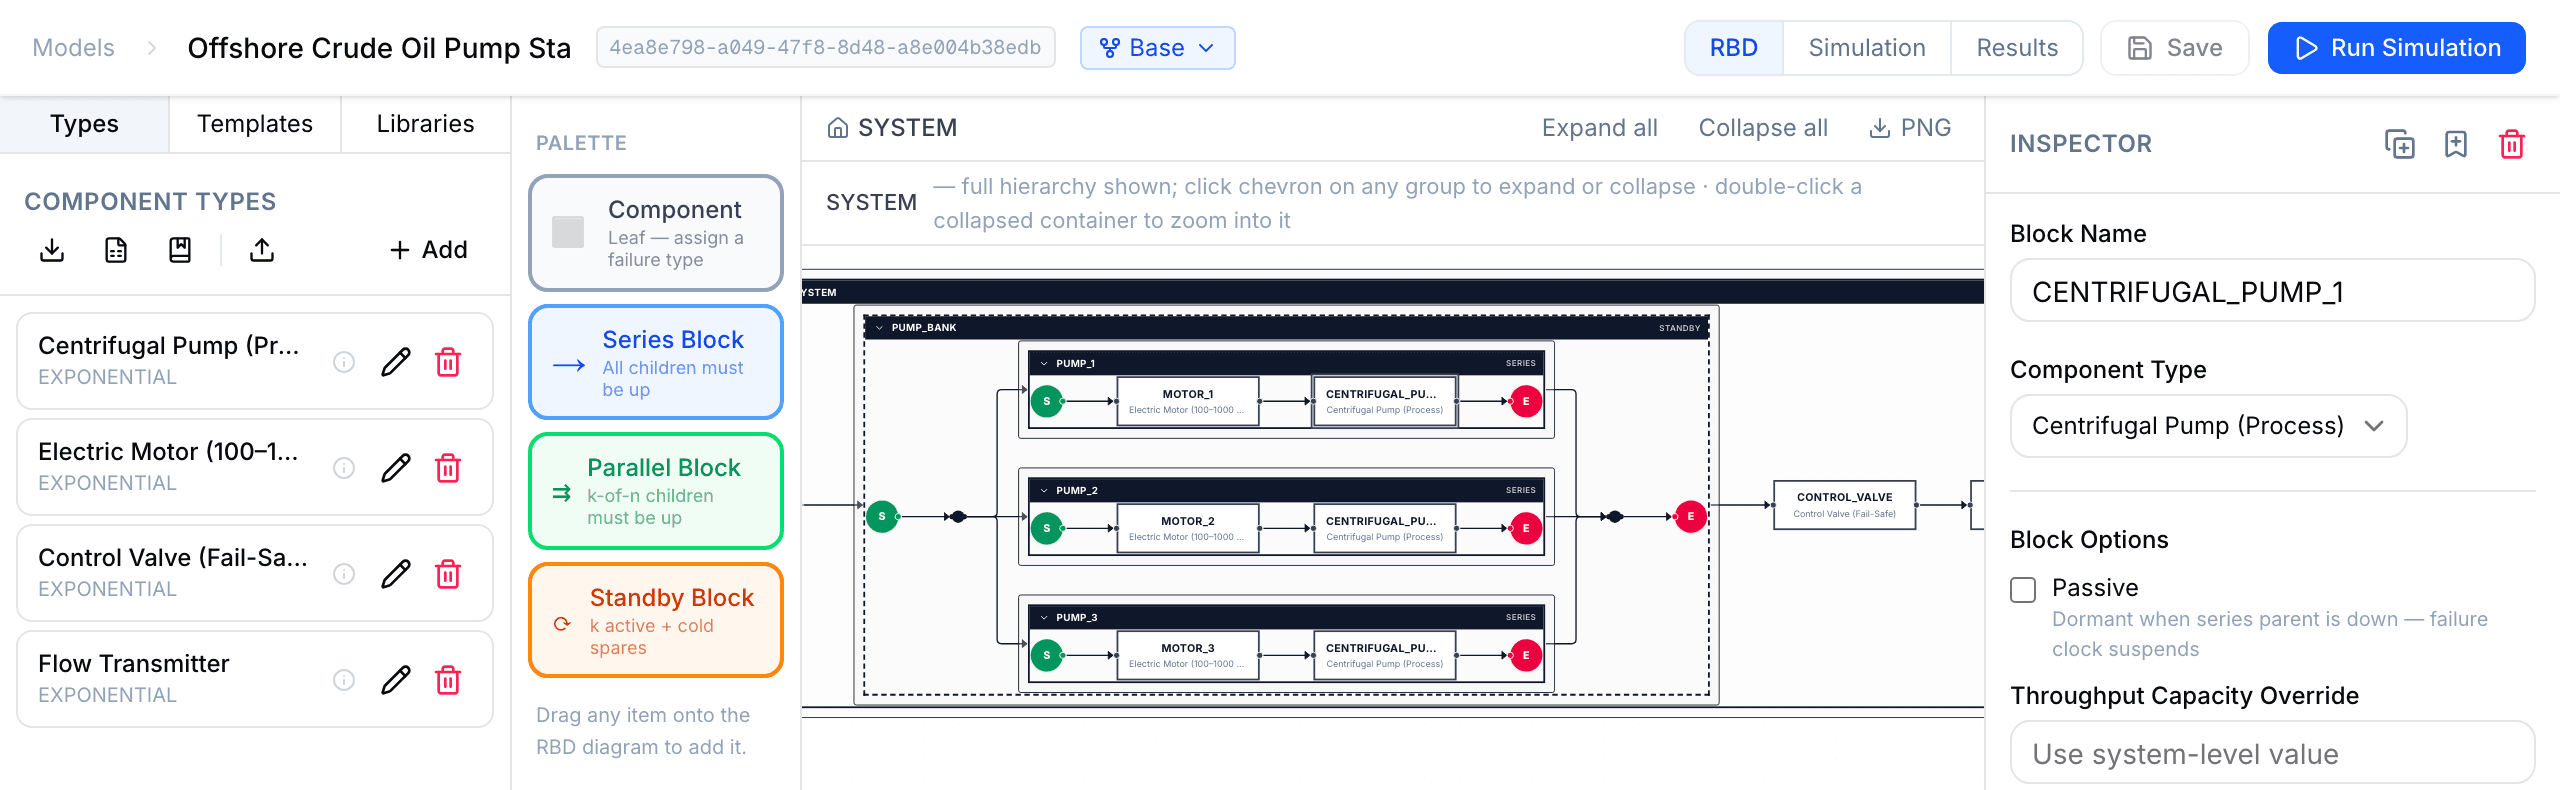
This Is Ramly — Not a Mock-up
A real example model and a real analysis result, exactly as they appear in the app. Every account includes six worked example models — including one set up for the exact analytical solver — so you can explore before building your own.
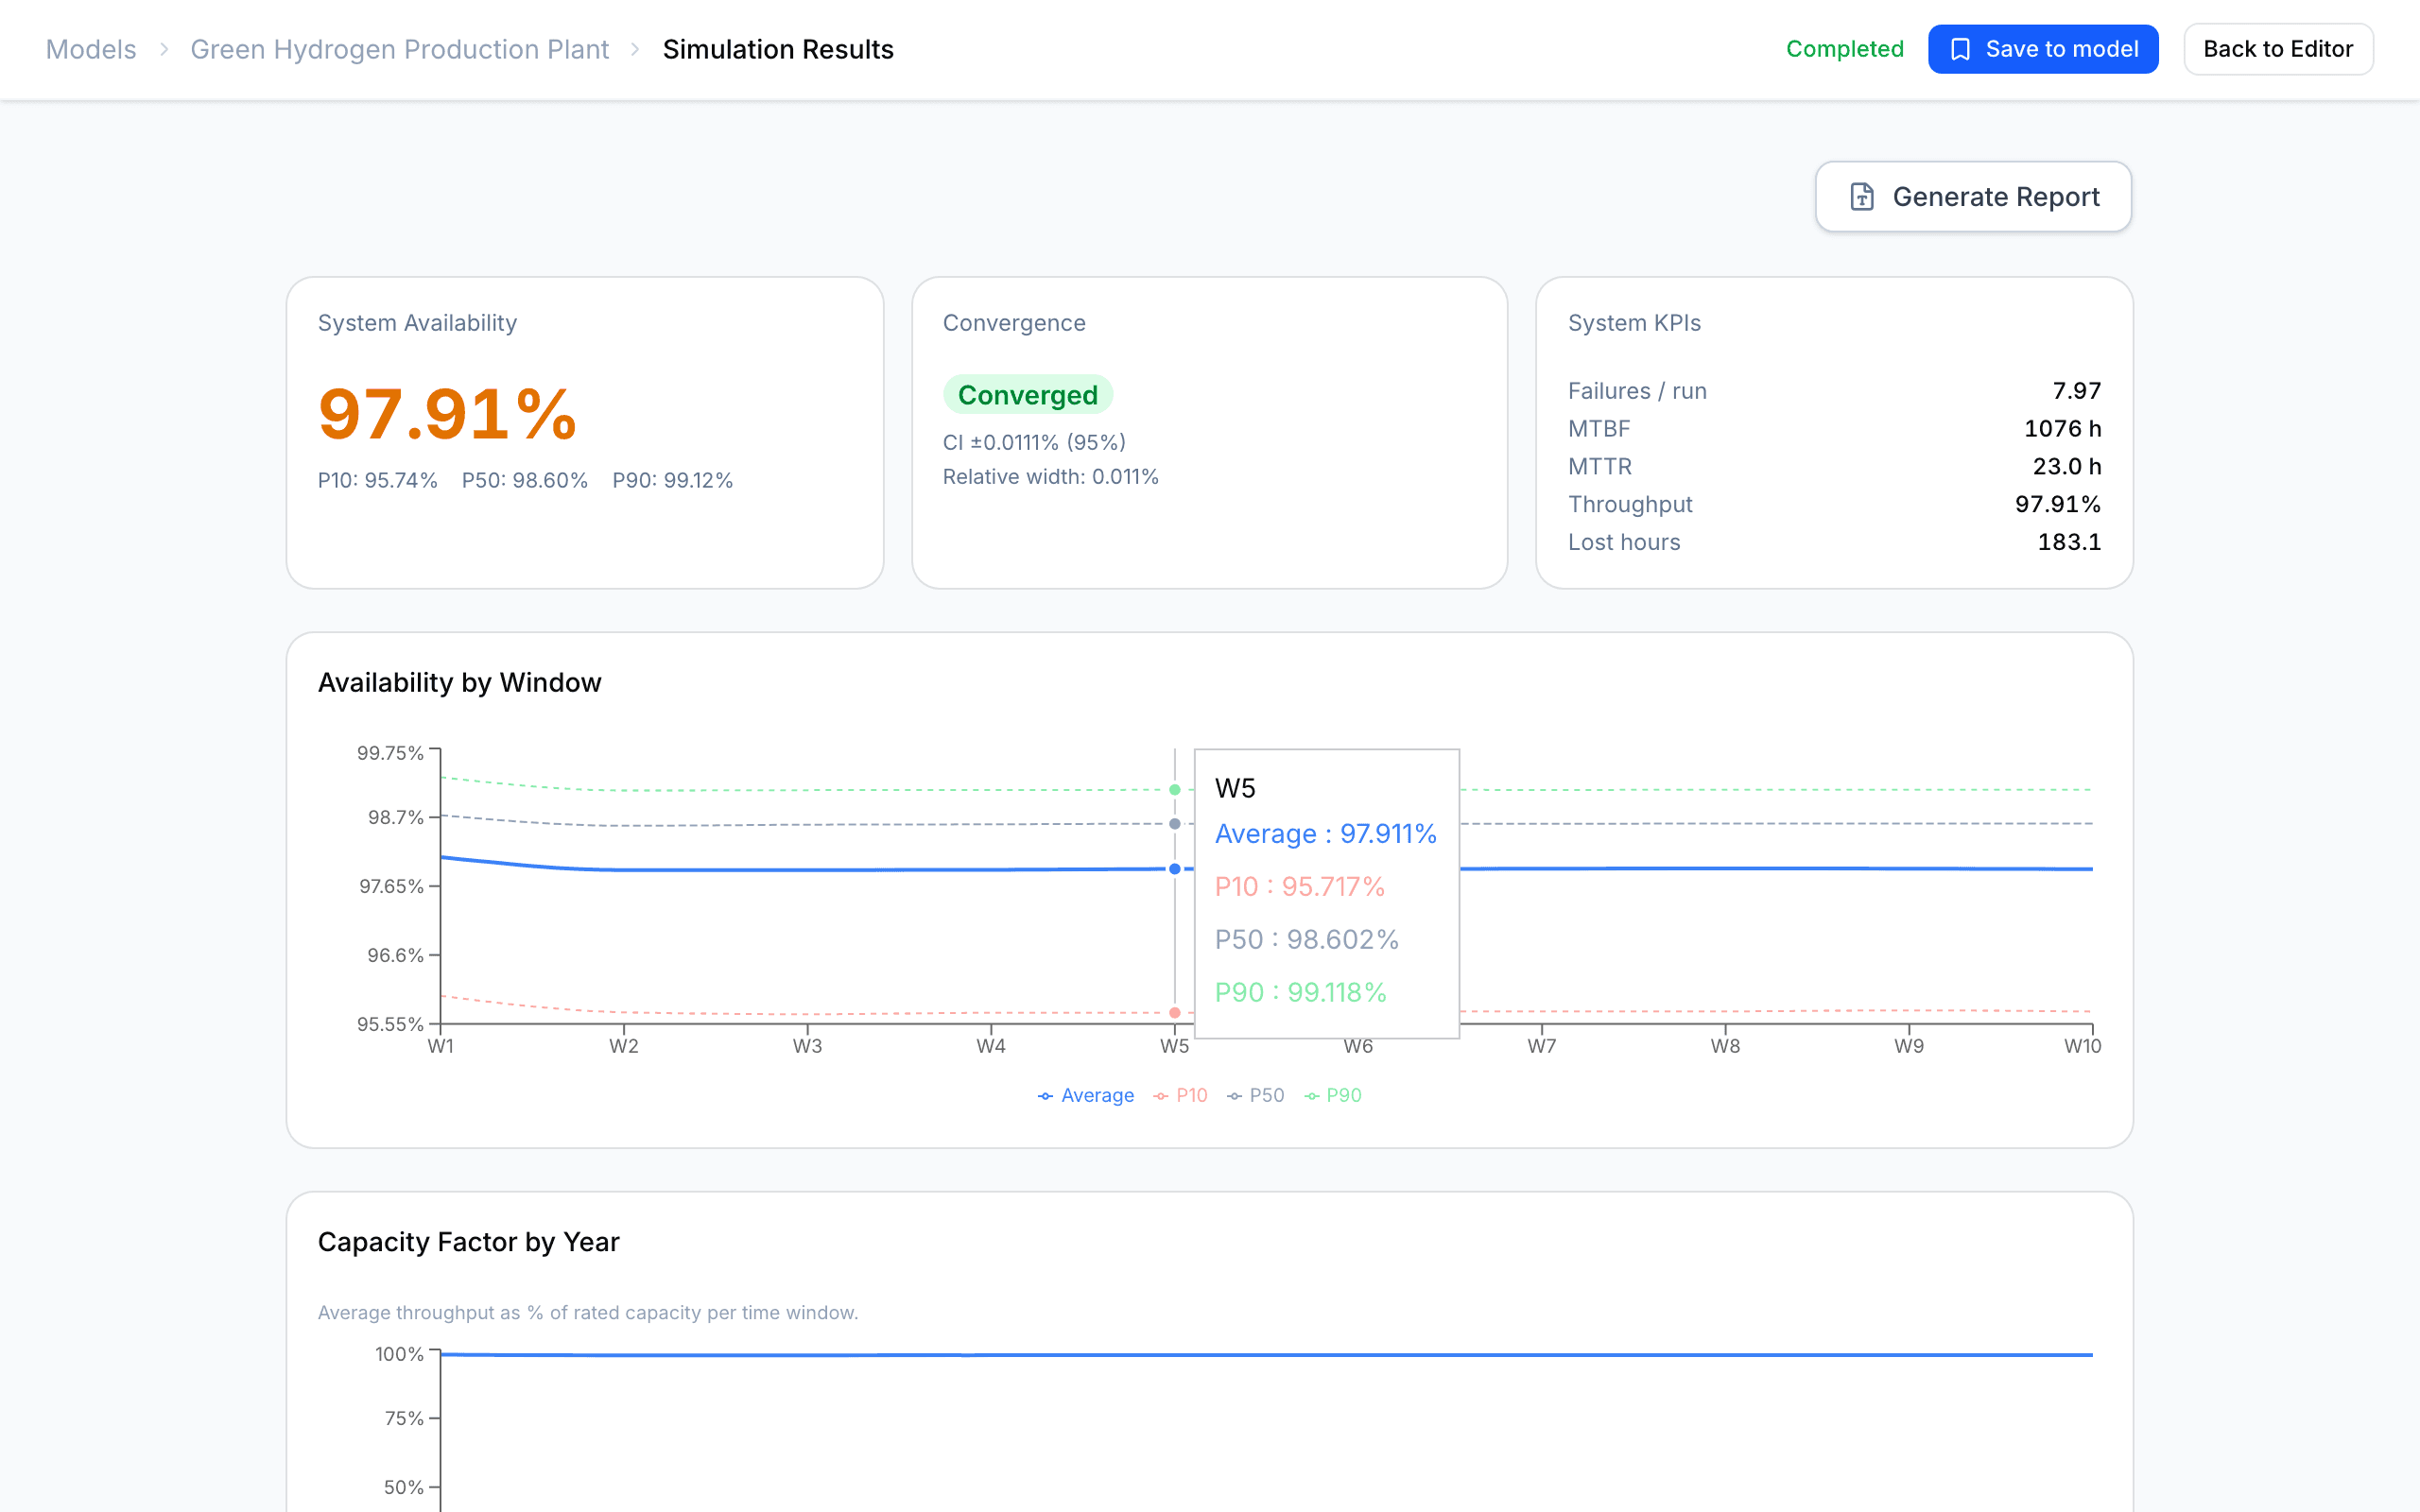
From diagram to defensible numbers
- ▸Availability with uncertainty. Average plus P10 / P50 / P90 percentiles from thousands of Monte Carlo runs — not a single optimistic point estimate.
- ▸Or an exact answer, instantly. Switch to the analytical (Markov) solver for closed-form availability, reliability R(t) and MTTF with no sampling error.
- ▸Reproducible by design. Fix the random seed and any colleague re-running the study gets the identical result.
- ▸Standards-based method. The RBD technique standardised in IEC 61078, built for production-assurance studies of the kind described in ISO 20815.
The Tools That Hold You Back
Hand-calculated MTBF and availability figures treat failure as deterministic. One wrong assumption and the whole study is wrong — with no way to know.
Leading RAM tools require a Windows install, an IT ticket, a site license, and a week to configure. By the time the software is ready, the design window has closed.
Evaluating 1+1 vs 2+1 redundancy, different storage sizes, or PM interval trade-offs means duplicating workbooks and reconciling results by hand.
From Diagram to Decision
Drag and drop blocks onto the RBD diagram to build your Reliability Block Diagram. Define series, parallel and k-of-n configurations. The diagram updates live as you build.
- Drag-and-drop block editor
- Series / parallel / k-of-n logic
- Subsystem grouping & nesting
- Import from plant data
- Visualised in real-time
Enter failure and repair behaviour for every block — MTTF, MTTR and a distribution. Seven distributions cover everything from random to wear-out failures; plug in field data or start from built-in ISO 14224-aligned reference data.
- Seven failure distributions
- MTTF · MTTR · logistics delay
- PM, crews, spares & common-cause
- Throughput capacity for production loss
- Built-in ISO 14224-aligned indicative data
Pick a solver — Monte Carlo simulation or the exact analytical (Markov) solver — set the horizon, and get availability, reliability and importance results. Export to PDF, Word or Excel.
- Monte Carlo engine, up to 100K runs
- Exact analytical (Markov) solver — instant
- Time-dependent A(t), R(t) and MTTF
- Importance & sensitivity (Monte Carlo)
- PDF / Word / Excel export
Everything a RAM Engineer Needs
Drag-and-drop editor: series, parallel (k-of-n) and cold/warm standby, nested to any depth. Save sub-diagrams as reusable templates; import and export whole models as JSON.
Discrete-event simulation, up to 100,000 runs per study. Seven failure distributions — Weibull, exponential, lognormal, normal, uniform, triangular and constant. A convergence check tells you when the answer is stable.
Prefer an exact answer? Solve the same diagram in closed form — instant, no sampling error. Exact RBD algebra plus Markov (CTMC) for standby, common-cause and multi-state, with time-dependent availability A(t), reliability R(t) and MTTF.
Preventive maintenance, logistics delay, spare pools with stock-out tracking, shared repair crews that queue, and common-cause failures — the downtime your support organisation really adds, not just ideal repair time.
Model dormant failures that stay silent until a proof test — or a demand on the redundancy — reveals them: the dominant risk for redundant and protective equipment. Inspection plans (per component or block) reveal them and start repair; results report mean time undetected and PFDₐᵥᵍ.
Set real-unit throughput capacities and get production availability and lost production in t/h, not just a percentage. Multi-state components can run at reduced rates; storage buffers ride through short outages before downtime counts.
Availability with P10/P50/P90 percentiles, MTBF, MTTR and throughput — plus Birnbaum, RAW and RRW importance and ±20% MTTF/MTTR sensitivity to rank the loss contributors.
Fix the random seed and any reviewer reproduces your result exactly. A Python API (libram) drives runs from your own scripts for batch studies and automation.
Built-in ISO 14224-aligned indicative failure data to start from — verify against a licensed source before engineering use. The RBD technique of IEC 61078, for production-assurance studies framed by ISO 20815. Export formatted PDF and Word reports plus JSON, CSV and Excel.
Runs in any browser — nothing to install, on macOS, Windows or Linux. Session authentication, hashed session tokens and per-account data isolation keep your models private.
Built for the Engineers Who Run RAM Studies
Oil & gas, power generation, process chemicals, manufacturing — wherever system reliability matters
- ▸Size storage buffers for target availability
- ▸Justify 1+1 vs 2+1 redundancy with numbers
- ▸Determine minimum spare holding levels
- ▸FEED studies for new plant or major modifications
- ▸Quantify reliability impact of cost-cutting options
- ▸Current system availability quantification
- ▸Identify the weakest link using importance measures
- ▸Model proposed modifications before committing CAPEX
- ▸Common-cause failure and CCF group assessment
- ▸Throughput loss and production risk reporting
- ▸PM interval optimisation — find the right frequency
- ▸Crew sizing — how many repair crews are enough?
- ▸Spare replenishment frequency and stockout risk
- ▸Cost of downtime vs preventive maintenance trade-off
- ▸Sensitivity to MTTR and logistics delay assumptions
Start with a finished study
New tool, tight deadline? Our team builds your first RAM study end-to-end and hands you the model and the report — then you own it. It de-risks adoption: a finished, defensible study now, and the engine to maintain it after. Prefer to build it yourself? The self-serve plans are below.
Scope & data
We define the system boundary, failure modes and operating context with your engineers, and gather your equipment and maintenance data — or start from indicative data and refine it together.
Build & simulate
We build the validated reliability block diagram — redundancy, standby, spares, common-cause, maintenance — and run it both by Monte Carlo and the analytical solver for availability, MTBF/MTTR, production loss and cost.
Report & deliver
You receive a formal RAM study report (PDF + Word): system availability with P10/P50/P90, MTBF/MTTR, production-loss and cost figures, and clear redundancy, sparing and maintenance recommendations — plus a live walkthrough of the results with your team.
Hand over & train
The finished model is delivered into your own Ramly account under licence, and we train your engineers to update inputs, add scenarios, and re-run it themselves as the design evolves.
What you walk away with
- A validated reliability model, in your Ramly account
- A formal, defensible RAM study report (PDF + Word)
- Redundancy, sparing & maintenance recommendations
- A results walkthrough + hands-on training for your team
- A licence to own, update and extend the model yourself
Simple, transparent pricing
Start free, or subscribe for unlimited models and the full analysis suite. Every new account includes a 14-day Professional trial — no card required.
Starter
Explore the tool at your own pace.
- Monte Carlo & analytical solvers
- RBD editor
- PDF & DOCX reports
Professional
For individual engineers running serious studies.
- Everything in Starter
- Unlimited component types
- Up to 100,000 simulations per run
- Reliability R(t), MTTF & production availability
- Scenario comparison
- CSV & Excel import
- Priority support
Team
For reliability teams sharing models and results.
- Everything in Professional
- Pooled quota across team
- Centralized billing
Enterprise & done-for-you
Custom seats · Unlimited runs · On-premise · SSO · or have us build your first model & train your team
Cancel anytime from your account. Prices in USD, exclusive of any applicable taxes.
Join the Engineers
Already Using Ramly
Create a free account and start your 14-day Professional trial — no credit card required. Build your first reliability model in minutes.
Already have an account? Sign in → · Want the details first? Read the guide →